How to Create a Panel Survey
Last updated more than 2 months ago |
Print
Panel Surveys, also known as longitudinal data, is useful when you want to measure changes over time. You may create a Panel Survey in Essentials by inviting the same group of respondents by email to answer the same Quest several times.
This article will first demonstrate an example for how to create a panel survey, then how to report on panel data.
In order to create a panel survey in Essentials, three preconditions must be in place:
- You need to allow for multiple responses per respondent and invite the same respondents over time
- You need to add filterable time identifiers using respondent data (e.g. Week or Month)
- You need to ask the same questions over time
- You can enable multiple responses per respondent for a Quest in Settings and Response Options. This will allow the exact same respondents to answer multiple times.

- You will need to upload new, updated time identifier with each batch of respondents. This allow grouping responses from the same batch together, as well as separating distinct responses from the same respondents and separate responses from distinct time intervals.
First create an Excel sheet which include at least one time-identifier as respondent data:

Second, you may upload the file in Distribution Add Invitees Upload File:

For the same respondents to able to answer over time, it is vital to use the setting “Import all invitees and create duplicates if they exist (duplicates allowed)” when importing new batches:

- The last step is to add your Questions. To ensure consistency in the data it is best to keep the exact same questions and answer alternatives through the whole survey:

Reporting on panel data
To measure the changes over time you will need to create value filters for all the answer alternatives for your time identifiers. This can either be done by uploading dummy respondents with all possible combinations, or by adding new filters after each time you upload respondents with new respondent data (i.e. new weeks or new months):
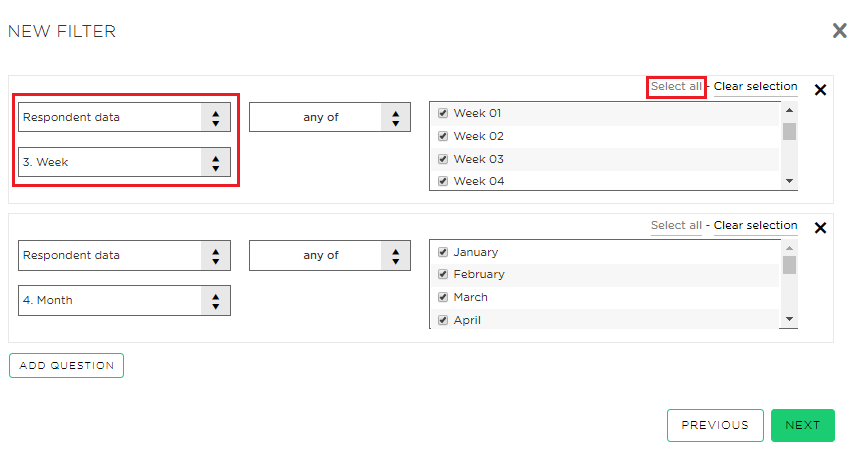
Add the Question you want to analyse in your report for and use Add series and Add Cross Tabulation with the (relevant respondent data):

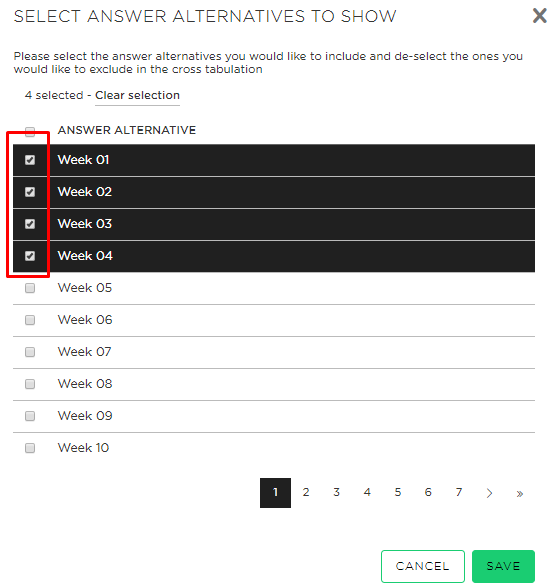
If you want to analyze some weeks only, select only the corresponding alternatives:
To increase readability of the results, consider taking the following these steps:
- Change the Question Text label to a description that includes information about the time dimension for the results (e.g. “… January” or “… 2019”)
- For Display Settings, useful options include:
- selecting the Chart Type “Column”
- selecting Show data as “Average”
- selecting a Sorting that present columns in consecutive order from the earliest date to latest date
- tick on Show Data Labels in Chart
- tick on Show Response Count in Chart
- Use a Color Scheme with gradients that highlight changes over time (e.g. “cold”)
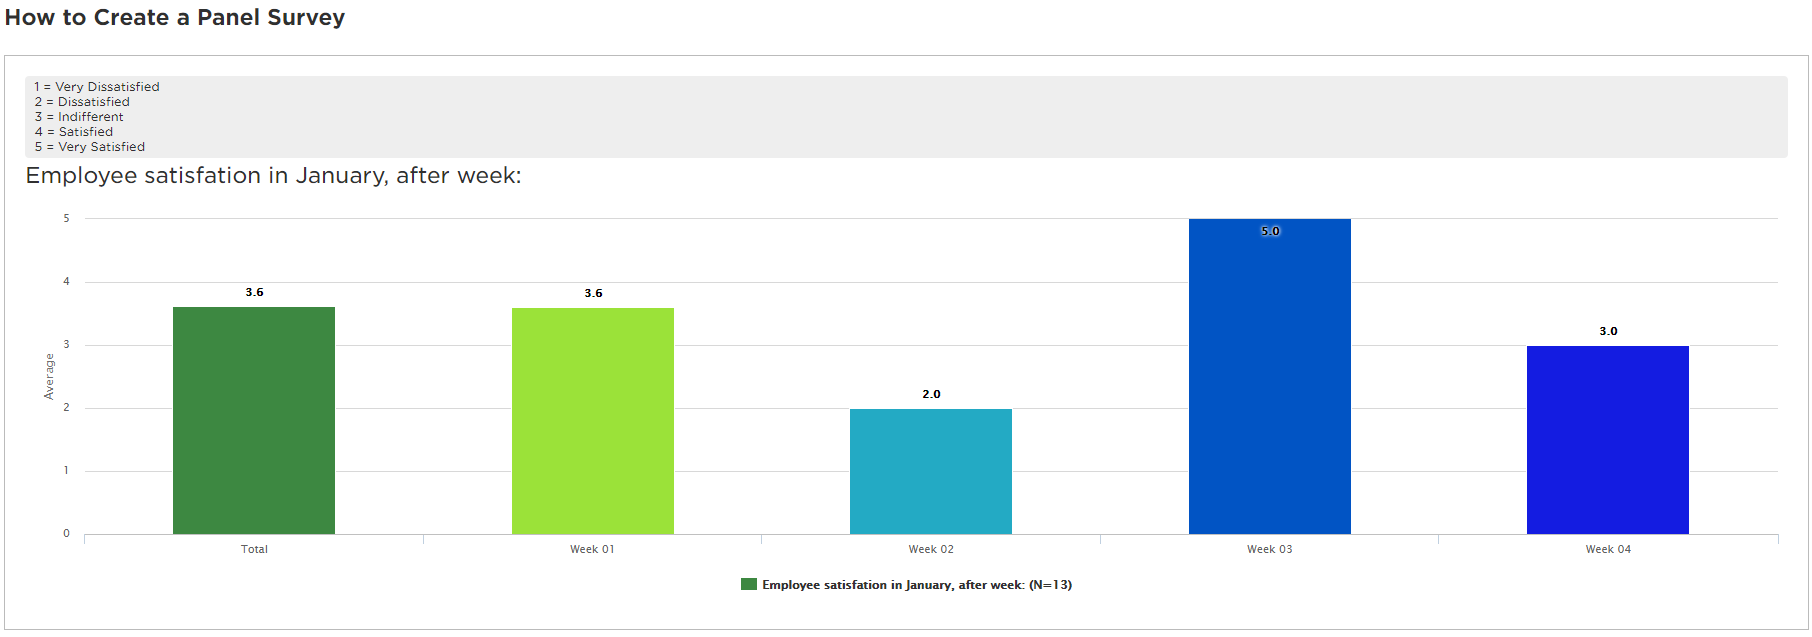
- Insert the scale of the given Question in the additional information

The above settings will result in a LiveReport graph like below:
It might also be useful to prepare a LiveReport that allow for future responses to show with time: